Classifying Namibia’s savanna: Turning drone imagery into vegetation base maps
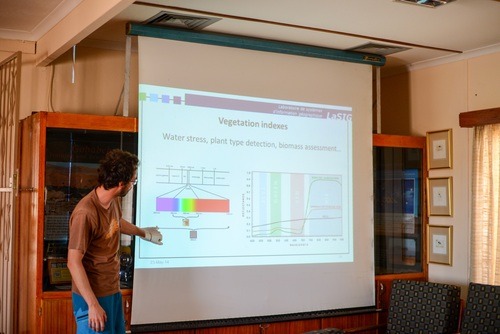
Timothée Produit of EPFL’s LASIG lab was part of our Namibian mission in May 2014. During the mission, Tim gave lectures both at the Polytechnic of Namibia as well as at the Gobabeb Research & Training Center on how to use the acquired drone imagery to classify terrain. Once all the imagery of the mission had been processed back home in Switzerland, Tim went on to use our data for classification purposes.
In this blog, we explore how to use multi-spectral imagery acquired by the eBee, processed into orthomosaics using Pix4Dmapper, to create vegetation base maps.
A “quick and dirty” classification of the Namibian savanna
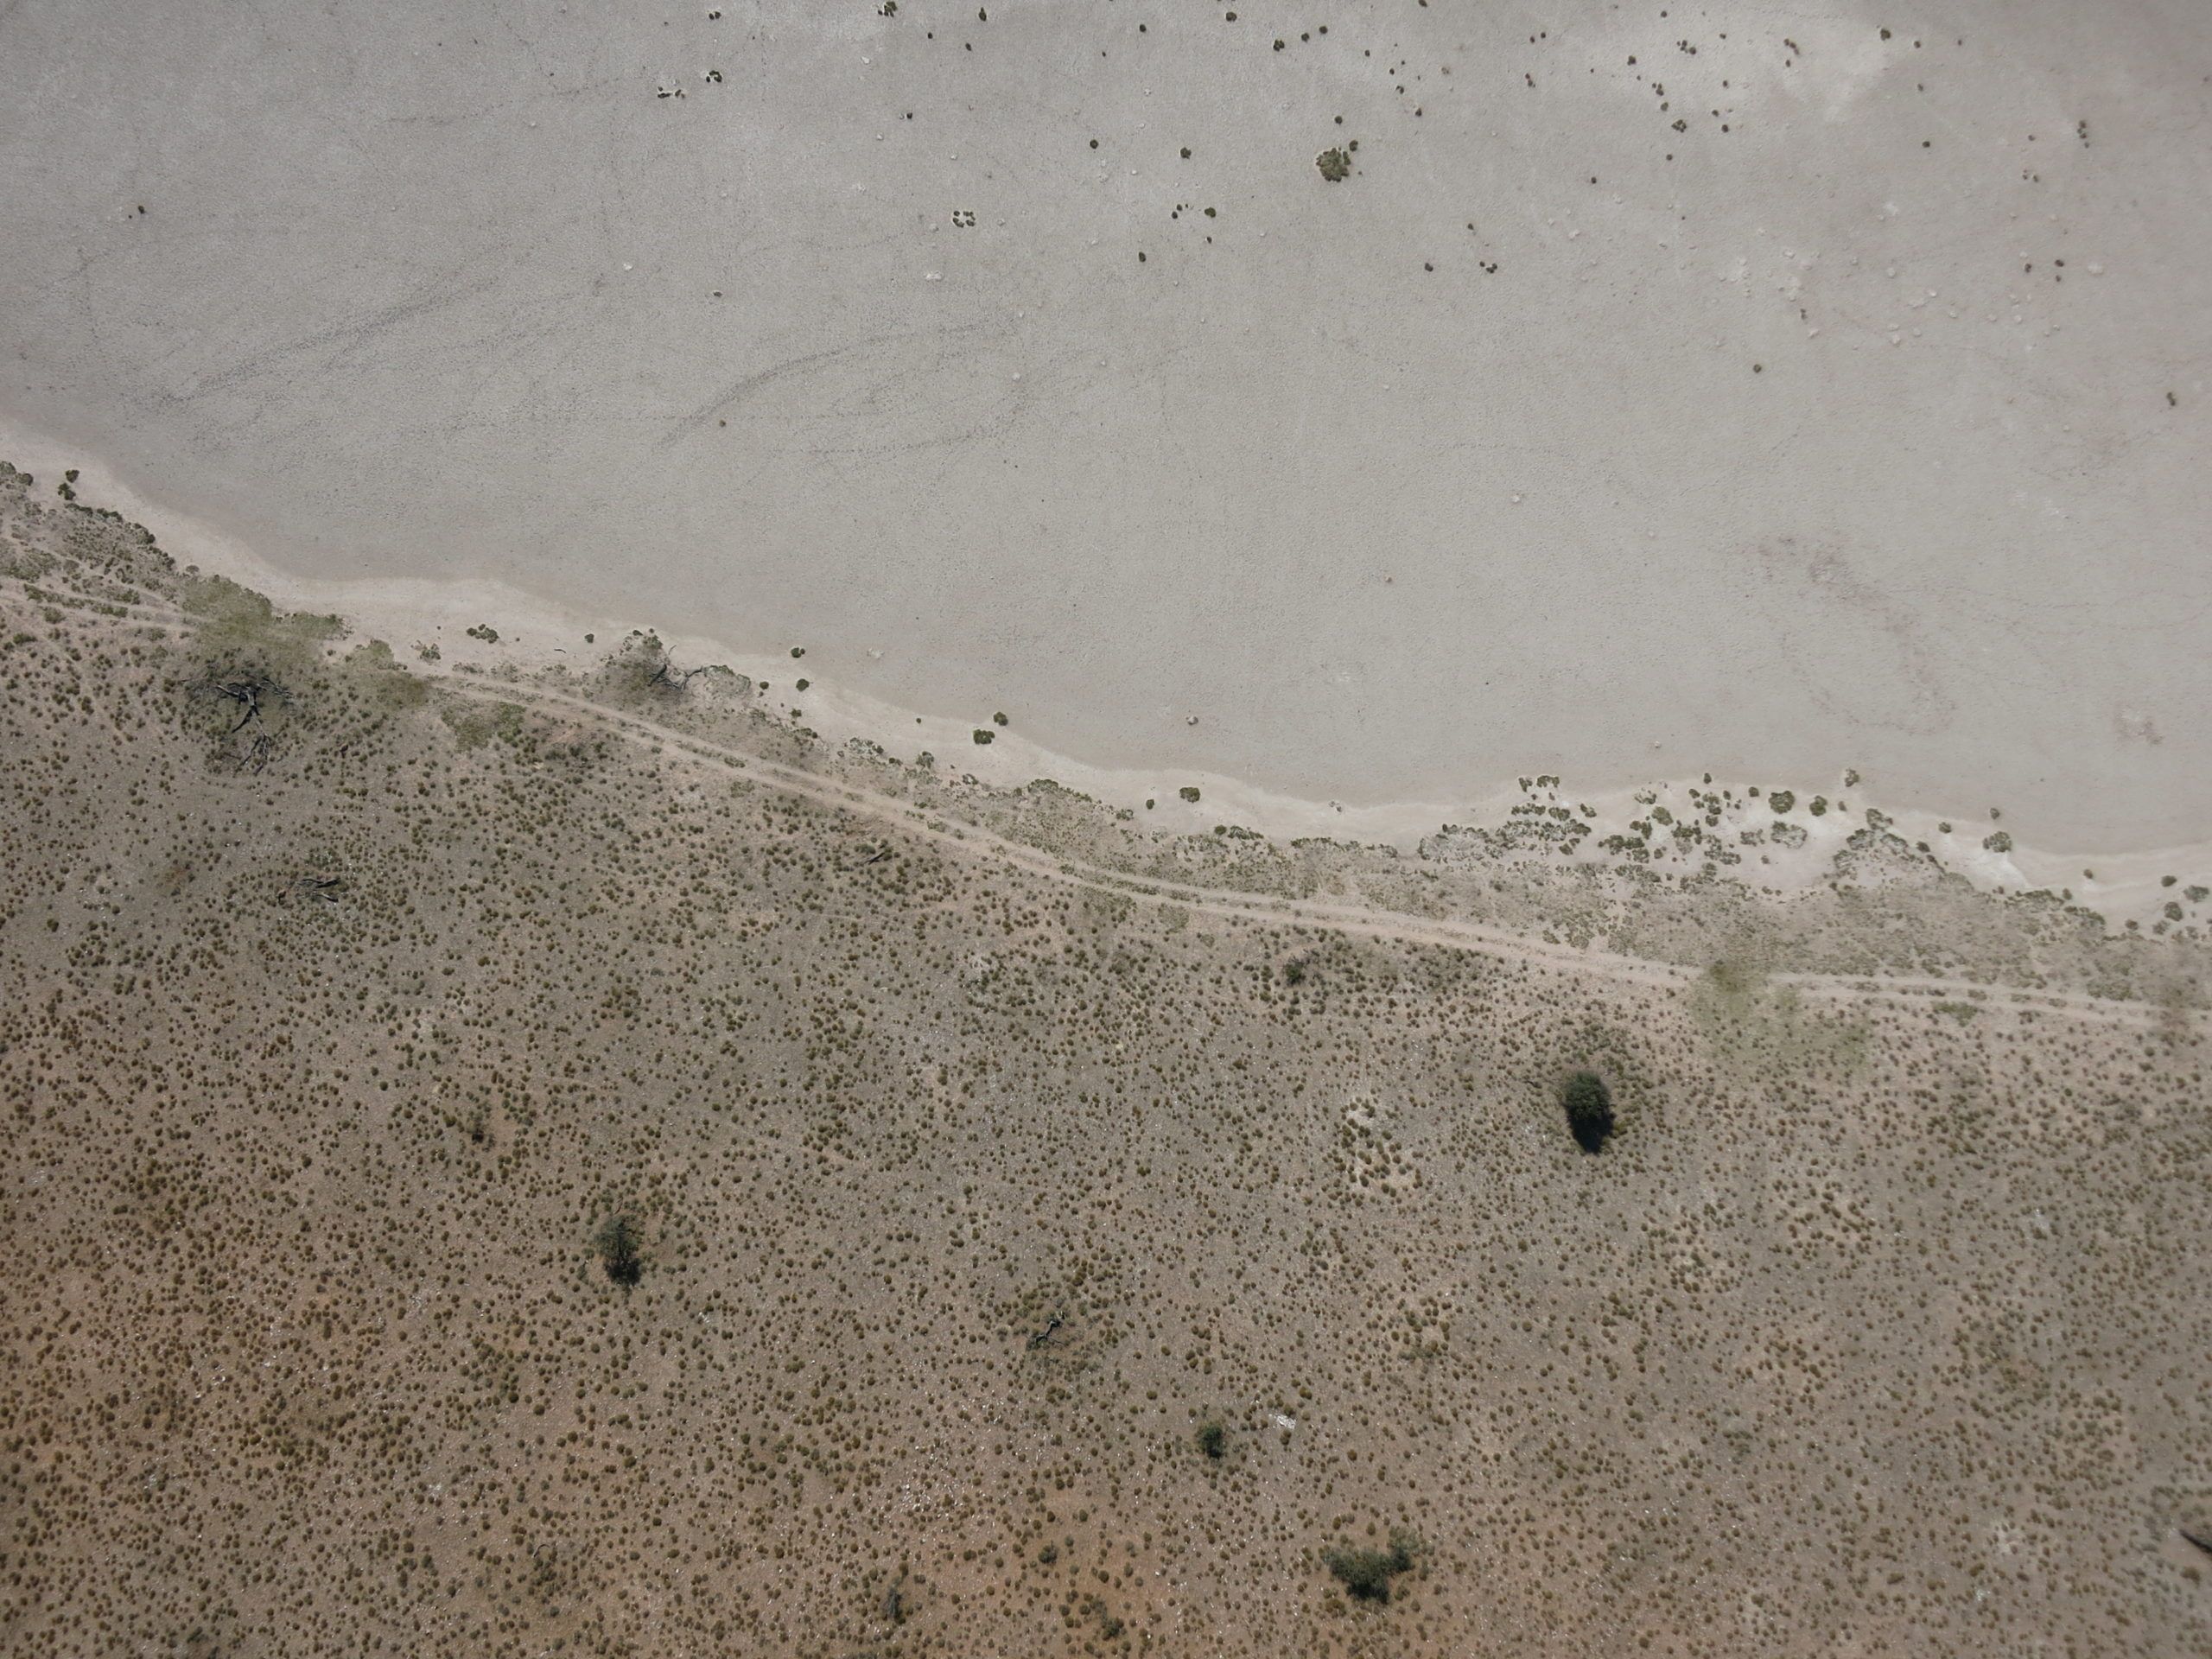
Aerial photographs, such as those obtained with ultralight drones offer a unique perspective on landscape dynamics. Through a process called orthorectification, raw aerial images are transformed into orthoimages – images with the same geometric properties as maps (i.e. where optical deformations such as those due to perspective are corrected). Multiple orthoimages can be stitched together to form an orthomosaic – a paramount product to update maps and provide a detailed view of the landscape. However, without further processing to produce more abstracted (read less detailed) representations, orthoimagery may only have a limited value for casual users such as farmers. Indeed, the power of maps resides in the simplification and abstraction of details to highlight specific topics (e.g. social, environmental, economic, etc).
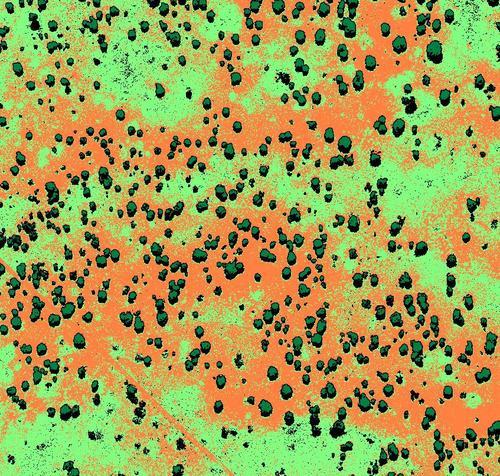
In this post, we will focus on the creation of a savanna vegetation basemap by employing supervised classification. In this context, the purpose of classification is to associate each pixel of the orthoimage with a specific land cover class. We will illustrate a simple scheme to classify a NIR (i.e. Near Infra-Red) orthomosaic into four basic classes (trees, bare soil, grass and shadow).
Several open source tools offer pre-implemented algorithms for image classification: Orfeo toolbox, SAGA, multispec or the semi-supervised classification plugin for QGIS are a few examples. We used SAGA which is a C++ based GIS offering powerful raster/vector processing and analysis tools. Although it has a relatively steep learning curve, it is very efficient to process large data sets – a particularly important feature when working with very high resolution imagery (in our case 5 cm).
Creating our savanna vegetation basemap
A NIR image has three spectral bands: the near-infrared band replaces the blue band, the two other bands measure the green and red responses. A vegetation index is based on the fact that plants reflect NIR radiation, which is too low in energy for the photosynthesis, but absorb the visible light. In other words, this means that vegetation has a very recognizable spectral signature in multispectral imagery. Usually, a variant of the ratio of red and NIR bands is used to create vegetation indexes that provide an indication of photosynthetic activity. Similarly, classification algorithms can use such spectral signature differences to detect the most probable class of a pixel.
The overall process is divided into three main steps:
First, we create a vegetation index map that will give us an indication of the photosynthetic activity in each cell of the orthomosaic.
We then associate each pixel with one class (for instance: tree, soil, grass and shadow) for the analysis of the land cover partition
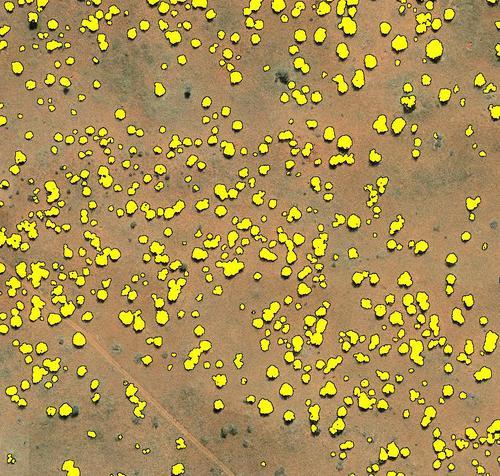
Finally and based on the this classification, we quantify the number of trees
As its names implies, a supervised classification requires supervision by an expert user. This user manually provides examples of areas for each considered land cover class. The pixels contained in those areas form a training set. Then, a classification algorithm automatically attributes the remaining pixels to each class, based on their similarity to the training samples.
Click here to download the guide that shows you step by step how we created our Vegetation basemap.
Counting trees
The Namibian savanna is a textbook case for imagery classification. Land cover classes are well separated in the spectral and spatial dimensions which explains the good results of the acacias detection. With some extra work, on the basis of this initial rough classification, a specialist can expand this basemap by labeling more vegetation classes (e.g. types of bushes, grasses, acacias, etc).
As implied in the title, this is really a “quick and dirty” approach. Indeed, the integration of structural 3D information in the classification pipeline would largely increase the quality and detail of the classification procedure.
In summary, supervised classification provides an easy way to produce vegetation maps by automatically reproducing expert visual interpretation based on training examples. The end product can be used by farmers to quickly evaluate changes in vegetation patterns over time.